

In the first three months of 2024, we have seen major growth, crises, and an important incident. The crises in the Panama and Suez Canals, Red Sea, and Middle East caused fluctuations in ocean freight rates and longer transit times. The Chinese New Year increased import demand, leading to limited space and capacity issues, which further impacted ocean freight rates. Additionally, the recent Baltimore incident resulted in shipping disruptions, including route diversions.
Containerized Import Volumes
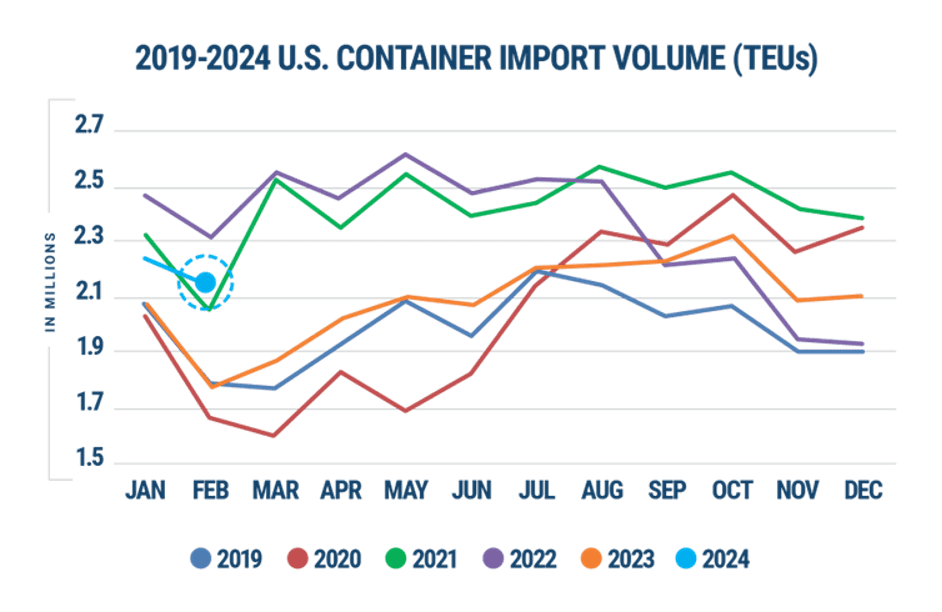
Despite these challenges, U.S. containerized import volume increased by 7.9% from the previous month, marking the largest month-over-month growth for January in the last seven years. The biggest increase was in China imports, which saw a 14.9% rise. However, in February, total import volume declined by 6% from January, but still jumped by 23.3% compared to the same month last year.
Recent data indicates that 2024 has had the best start for U.S. imports compared to pre-pandemic years. While there has been a temporary downward trend in import volume due to seasonal impacts, it is expected to rise again in the spring.
Port Efficiency
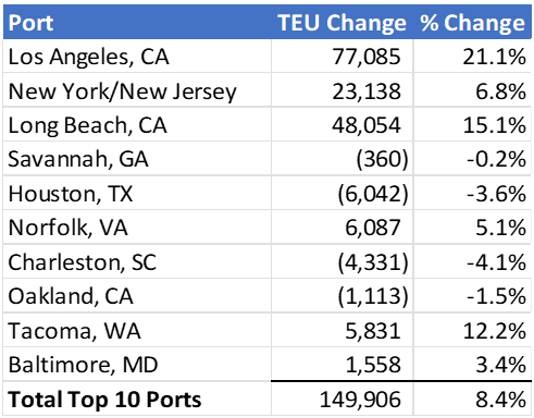
As always, the busiest ports in the U.S. continued to be the ports of Los Angeles, Long Beach, and New York. However, in January 2024, there was a noticeable surge in activity at the Port of Los Angeles, which handled 77,000 TEUs (twenty-foot equivalent units), compared to December 2023. New York and Long Beach maintained their positions as the second and third busiest ports, respectively.
The uptick in activity can be attributed to various factors. For instance, the Chinese New Year typically leads to increased shipping activity as companies rush to fulfill orders before the holiday shutdowns in China. Additionally, the ongoing crisis in the Middle East may have disrupted traditional trade routes, leading to a shift in activity between East and West Coast ports.
Transit Times
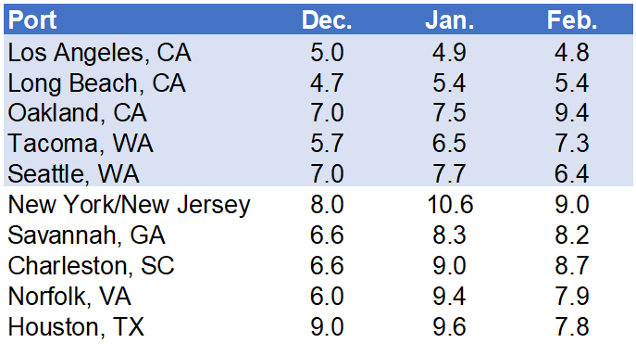
The difference between ETA (estimated time of arrival) and ATA (actual time of arrival) serves as a crucial metric for evaluating the efficiency of transit times within the maritime industry. Since the beginning of the pandemic, port delays have a notable surge, affecting global supply chains.
Data from the first two months of 2024 indicates a concerning upward trajectory in port delays, reflecting ongoing operational strains. Among the top 10 ports analyzed, the Ports of New York/New Jersey emerged as particularly affected, experiencing the most significant delay, averaging around nine days. In contrast, the Ports of Los Angeles/Long Beach exhibited comparatively lower delays, averaging five days.
In conclusion, the first quarter of 2024 witnessed both growth and challenges in the maritime industry.
Despite crises in transit routes and capacity constraints, U.S. containerized imports surged, particularly from China. Major ports like Los Angeles, Long Beach, and New York maintained their prominence, with Los Angeles experiencing increased activity. However, port efficiency challenges persist, with delays notably impacting the New York/New Jersey ports. Moving forward, monitoring these challenges will be essential for evaluating momentum in U.S. import trade.